import biggles
import numpy
#
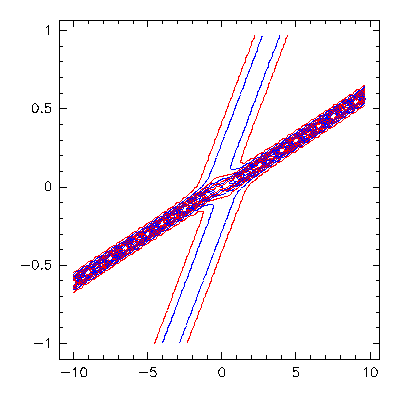
# Create example 2-dimensional data set of two solitons colliding.
#
n = 64
x = numpy.arange( -10., 10., 20./n )
t = numpy.arange( -1., 1., 2./n )
z = numpy.zeros( (len(x),len(t)) )
for i in range(len(x)):
for j in range(len(t)):
z[i,j] = -12. * (3. + 4.*numpy.cosh(2.*x[i]-8.*t[j]) \
+ numpy.cosh(4.*x[i] - 64.*t[j])) / \
(3.*numpy.cosh(x[i]-28.*t[j]) \
+ numpy.cosh(3.*x[i]-36.*t[j]))**2
#
# Make contour component.
#
c = biggles.Contours( z, x, t, color="red" )
#
# For fine-grained color control, the Contours component allows you to
# specify a function which returns the color applied to each contour line.
# The arguments passed to the function are:
#
# i integer index of contour (0,..,n-1)
# n total number of contours
# z0 z value of contour
# z_min minimum z contour value
# z_max maximum z contour value
#
# The function should return a valid color, or None for the default.
#
# Here we show how to set every other contour to blue. The remaining
# contours are drawn with the default color, defined above to be red.
#
def even_blue( i, n, z0, z_min, z_max ):
if i % 2 == 0:
return 0x0000ff
return None
c.func_color = even_blue
#
# Similarly, Contours accepts similar functions for line type (.func_linestyle)
# and width (.func_linewidth). The arguments passed are the same.
#
#
# Make framed plot container and add contour component.
#
p = biggles.FramedPlot()
p.add( c )
#
# Output.
#
p.write_img( 400, 400, "example8.png" )
p.write_eps( "example8.eps" )
p.show()